shinyreact
Building Custom Shiny UI with React
Barret Schloerke
posit / Shiny Team
@schloerke
Old Faithful
Old Faithful
#| '!! shinylive warning !!': |
#|   shinylive does not work in self-contained HTML documents.
#|   Please set `embed-resources: false` in your metadata.
#| standalone: true
#| components: [viewer]
#| viewerHeight: 1080
library(shiny)
library(bslib)

ui <- page_sidebar(
  # Sized for a projector, not a laptop: this runs at 1:1 with the 1920x1080
  # canvas, same as the other two demos' `html { font-size: 26px }`.
  theme = bs_theme(font_scale = 1.6),
  # ionRangeSlider's parts are fixed px whatever the font size is: 11px bubble,
  # 10px min/max, 9px grid, a 3px bar and a 19px handle. Scaling the whole
  # widget with a transform fixes the size but shrinks the track to match, so
  # the parts are resized instead - each `top` re-centred on the same 40px axis.
  # `.irs-bar` needs `!important`: bslib's own rule lands after this style tag.
  tags$style(HTML("
    .irs--shiny { height: 80px; }
    .irs--shiny .irs-line { height: 8px; top: 36px; border-radius: 4px; }
    .irs--shiny .irs-bar { height: 8px !important; top: 36px !important; }
    .irs--shiny .irs-handle { width: 32px; height: 32px; top: 24px; }
    .irs--shiny .irs-single { font-size: 20px; top: 0; padding: 2px 10px; }
    .irs--shiny .irs-min, .irs--shiny .irs-max { font-size: 18px; top: 0; padding: 2px 8px; }
    .irs--shiny .irs-grid { top: 52px; height: 24px; }
    .irs--shiny .irs-grid-text { font-size: 16px; top: 12px; }
  ")),
  # shinylive runs this app in an iframe, so reveal never sees these keys. Hand
  # them back via reveal's postMessage API: triggerKey runs whatever reveal has
  # bound to the code. PageUp/PageDown is what most presenter remotes send and
  # no widget wants them, so they always go to the deck; a focused slider owns
  # the arrows and space, or advancing the deck would also drag the control.
  # Identical in all three demos (apps/0{1,2}-*/www/index.html) - change one,
  # change all three.
  tags$script(HTML('
    const deckKeys = { PageUp: 33, PageDown: 34 };
    const sharedKeys = { ArrowLeft: 37, ArrowUp: 38, ArrowRight: 39, ArrowDown: 40, " ": 32, Escape: 27 };
    addEventListener("keydown", (e) => {
      const widget = e.target instanceof Element &&
        e.target.closest("input, select, textarea, button, [contenteditable]");
      const keyCode = deckKeys[e.key] || (widget ? 0 : sharedKeys[e.key]);
      if (keyCode && parent !== window) {
        parent.postMessage(JSON.stringify({ method: "triggerKey", args: [keyCode] }), "*");
      }
    });
  ')),
  title = "Hello Shiny!",
  sidebar = sidebar(
    width = 420,
    sliderInput(
      inputId = "bin_count",
      label = "Number of bins:",
      min = 1,
      max = 50,
      value = 30
    )
  ),

  plotOutput(outputId = "distPlot")
)

server <- function(input, output) {
  # The plot's text is in device pixels, so `font_scale` does not reach it;
  # `res` is the lever for the chart, as the svg's width is for the React one.
  output$distPlot <- renderPlot({
    x <- faithful$waiting
    breaks <- seq(min(x), max(x), length.out = input$bin_count + 1)

    hist(
      x,
      breaks = breaks,
      col = "#75AADB",
      border = "white",
      xlab = "Waiting time to next eruption (in mins)",
      main = "Histogram of waiting times"
    )
  }, res = 130)
}

shinyApp(ui = ui, server = server)
Ownership
- R owns both the UI definition and the reactive computation.
Custom UI… within a string
- How many of you have written JavaScript or CSS within a string?
React
React.dev

The library for web and native user interfaces
“…build user interfaces out of individual pieces called components”
Components
- A component is a function that returns HTML-like markup.
Rendered
ERUPTIONS 272
BINS 30
Components draw data’s state
waiting = [79, 54, 74, 62, …]bin_count = 12 → bins = [13, 19, 31, 20, …] →
waiting = [79, 54, 74, 62, …]bin_count = 30 → bins = [1, 8, 7, 10, …] →
Old Faithful
Old Faithful
app.tsx
function App() {
  const [binCount, setBinCount] = useState(30);
  const bins = useMemo(
    () => bin_data(waiting, binCount),
    [binCount]
  );

  return (
    <main className="layout">
      <label htmlFor="bin_count">Number of bins:</label>
      <input id="bin_count" type="range" value={binCount}
             onChange={(e) => setBinCount(Number(e.target.value))} />
      <Histogram bins={bins} />
    </main>
  );
}Why React?
- Massive adoption in the JS community
- GitHub:
![GitHub's sidebar badge: Used by 30M]()
reactalone pulled 170M downloads last week- Shiny has 50M downloads in 14 years!
- GitHub:
- Proven component libraries, design systems, charts, tables, maps



Why Shiny + React?
+
- 🚫 Hand-rolled HTML and JavaScript in Shiny
- 🧰 Use the proper tool for the job
- 🤖 AI excels at building well-known frameworks
The mark
shinyreact
Shiny UI infrastructure for React-based component rendering
- The Shiny server contains only reactive data computation
- The UI is a React client you own
shinyreactships zero UI components
Old Faithful
The server we started with
app.R
input$bin_count → breaks → hist() → renderPlot()
The same server, with shinyreact
app.R
input$bin_count → breaks → bins → reactive_output()
reactive_output() — a new concept!
- No 1:1 UI component needed
- Construct necessary data and send to client as JSON
- Let React display your data’s state in the UI
The UI we started with
shinyreact UI
Wait… what?
React
app.tsx
function App() {
  const [binCount, setBinCount] = useState(30);
  const bins = useMemo(() => bin_data(waiting, binCount), [binCount]);

  return (
    <main className="layout">
      <label htmlFor="bin_count">Number of bins:</label>
      <input id="bin_count" type="range" value={binCount}
             onChange={(e) => setBinCount(Number(e.target.value))} />
      <Histogram bins={bins} />
    </main>
  );
}shinyreact
www/ui.tsx
function App() {
  const [binCount, setBinCount] = useShinyInput<number>("bin_count", 30);
  const bins = useShinyOutputValue<HistData | null>("dist_data", null);

  return (
    <main className="layout">
      <label htmlFor="bin_count">Number of bins:</label>
      <input id="bin_count" type="range" value={binCount}
             onChange={(e) => setBinCount(Number(e.target.value))} />
      <Histogram bins={bins} />
    </main>
  );
}The data cycle
Browser · React
const [binCount, setBinCount] =
  useShinyInput("bin_count", 30)
const bins =
  useShinyOutputValue(
    "dist_data", null)
{ "bin_count": 30 }{ "dist_data": {…} }
Server · R / Python
input$bin_count
… <- reactive(…)
output$dist_data <-
  reactive_output({ … })
Old Faithful
#| '!! shinylive warning !!': |
#|   shinylive does not work in self-contained HTML documents.
#|   Please set `embed-resources: false` in your metadata.
#| standalone: true
#| components: [viewer]
#| viewerHeight: 1080

## file: app.R
# shinylive bundles `shinyreact` (and `brio`) into the render at build time,
# so nothing is installed at runtime. See CLAUDE.md.
library(shiny)
library(shinyreact)

# Base R ships the Old Faithful dataset; the Python servers read the same data
# from the faithful.csv exported next to this file.
x <- faithful$waiting

ui <- page_react_html("www/index.html")

server <- function(input, output, session) {
  # input$bin_count is NULL until the client's first
  # useShinyInput("bin_count", 30)
  # message arrives. Returning NULL leaves the React side on its "Loading…"
  # placeholder; req() would work too, but its silent error still reaches the
  # client. (Python's input.bin_count() raises a silent exception instead.)
  bin_count <- reactive(input$bin_count)

  output$dist_data <- reactive_output({
    n <- bin_count()
    if (is.null(n)) {
      return(NULL)
    }
    breaks <- seq(min(x), max(x), length.out = n + 1)
    bins <- hist(x, breaks = breaks, plot = FALSE)
    # I() keeps length-1 vectors as JSON arrays (n = 1) instead of scalars.
    list(breaks = I(bins$breaks), counts = I(bins$counts))
  })
}

shinyApp(ui, server)


## file: www/index.html
## type: text
<!DOCTYPE html>
<html lang="en">
  <head>
    <meta charset="UTF-8" />
    <meta name="viewport" content="width=device-width, initial-scale=1.0" />
    <title>Old Faithful — shinyreact</title>
    <!-- Shiny's and shinyreact's script/link tags are inserted here. It is a
         plain <meta> tag, so this file stays valid HTML. -->
    <meta name="shiny-dependency-placeholder" content="">
    <link rel="stylesheet" href="app.css" />
  </head>
  <body>
    <!-- The mount point. Visible until React takes over, so a slow bundle
         shows something other than a blank page. The styling goes on an inner
         div that React replaces - a class on #root itself would survive the
         mount, and `.placeholder`'s fixed height would then crop the app. -->
    <div id="root"><div class="placeholder">Loading…</div></div>
    <!-- `defer`, not a bare script: the shinyreact bundle in <head> is
         deferred, and deferred scripts run in document order. A non-deferred
         script here would run first and find no `window.shinyreact`. -->
    <script src="app.js" defer></script>
    <!-- shinylive runs this page in an iframe, so reveal never sees these keys.
         Hand them back via reveal's postMessage API. Identical in all three
         demos (apps/02-react-only/www/index.html, apps/00-old-faithful-trim/
         app.R) - change one, change all three. -->
    <script>
      // PageUp/PageDown is what most presenter remotes send and no widget wants
      // them, so they always go to the deck. A focused slider owns the arrows
      // and space, or advancing the deck would also drag the control.
      const deckKeys = { PageUp: 33, PageDown: 34 };
      const sharedKeys = { ArrowLeft: 37, ArrowUp: 38, ArrowRight: 39, ArrowDown: 40, " ": 32, Escape: 27 };
      addEventListener("keydown", (e) => {
        const widget = e.target instanceof Element &&
          e.target.closest("input, select, textarea, button, [contenteditable]");
        const keyCode = deckKeys[e.key] || (widget ? 0 : sharedKeys[e.key]);
        if (keyCode && parent !== window) {
          parent.postMessage(JSON.stringify({ method: "triggerKey", args: [keyCode] }), "*");
        }
      });
    </script>
  </body>
</html>


## file: www/app.css
## type: text
/* The only viewer of these two apps is a projector: they run in an iframe on a
   1920x1080 slide, at 1:1 with the deck's canvas. So the whole page is sized up
   from a laptop's defaults - everything below is in rem, and this is the one
   number that scales it. */
html {
  font-size: 26px;
}

body {
  margin: 0;
  padding: 0;
  background: #fff;
  font-family: system-ui, sans-serif;
  color: #1a1a1a;
}

.layout {
  display: flex;
  flex-wrap: wrap;
  gap: 1.5rem;
  /* Left-aligned and full-width, not a centred 60rem block: on the deck's
     1920px slide that left ~400px of white beside the sidebar that nothing
     collapses, and shrank the chart to something unreadable from the back. */
  margin: 1rem 0;
  padding: 0 1.5rem;
}

.sidebar {
  flex: 1 1 12rem;
  align-self: start;
  padding: 1rem;
  background: #f5f5f5;
  border-radius: 8px;
}

.sidebar label {
  display: block;
  margin-bottom: 0.5rem;
  font-size: 1.2rem;
}

/* A range input's thumb is a fixed ~16px whatever the font size, so it is
   scaled rather than sized; 2/3 width at 1.5x lands back on the full width. */
.sidebar input[type="range"] {
  width: 66.7%;
  transform: scale(1.5);
  transform-origin: left center;
}

.bin-count-value {
  display: block;
  margin-top: 1rem;
  font-size: 1.3rem;
  font-variant-numeric: tabular-nums;
  color: #666;
}

.panel {
  flex: 3 1 24rem;
}

/* The chart is width-driven (viewBox 620x320, `width: 100%`), so this cap is
   what keeps it inside the slide's height once the heading is above it. */
.panel svg {
  max-width: 1200px;
}

.panel h1 {
  margin: 0;
  font-size: 1.6rem;
}

.placeholder {
  display: grid;
  place-items: center;
  height: 20rem;
  border-radius: 8px;
  background: #f5f5f5;
  color: #888;
}

.recalculating {
  opacity: 0.6;
  transition: opacity 200ms;
}


## file: www/app.js
## type: text
const {
  React,
  ReactDOM,
  useShinyInput,
  useShinyOutputValue,
  useShinyOutputStatus,
  useShinyInitialized,
} = window.shinyreact;

const h = React.createElement;

// --- histogram chart -------------------------------------------------------

const W = 620;
const H = 320;
const M = { top: 16, right: 16, bottom: 52, left: 64 };
const PLOT_W = W - M.left - M.right;
const PLOT_H = H - M.top - M.bottom;

// Round `max` up to a friendly axis top, using a 1/2/5 × 10^n tick step.
function yTicks(max) {
  const raw = Math.max(max, 1) / 4;
  const mag = Math.pow(10, Math.floor(Math.log10(raw)));
  const step = [1, 2, 5, 10].map((m) => m * mag).find((s) => s >= raw);
  const top = Math.ceil(max / step) * step;
  const ticks = [];
  for (let v = 0; v <= top; v += step) ticks.push(v);
  return { top, ticks };
}

function xTicks(lo, hi) {
  const step = 10;
  const ticks = [];
  for (let v = Math.ceil(lo / step) * step; v <= hi; v += step) ticks.push(v);
  return ticks;
}

function Histogram({ bins }) {
  const { breaks, counts } = bins;
  const lo = breaks[0];
  const hi = breaks[breaks.length - 1];
  const { top, ticks } = yTicks(Math.max(...counts));

  const x = (v) => M.left + ((v - lo) / (hi - lo)) * PLOT_W;
  const y = (v) => M.top + PLOT_H - (v / top) * PLOT_H;

  return h(
    "svg",
    {
      viewBox: `0 0 ${W} ${H}`,
      width: "100%",
      role: "img",
      "aria-label": `Histogram of Old Faithful waiting times in ${counts.length} bins`,
    },
    // y gridlines + labels
    ticks.map((t) =>
      h(
        "g",
        { key: `y${t}` },
        h("line", {
          x1: M.left,
          x2: M.left + PLOT_W,
          y1: y(t),
          y2: y(t),
          stroke: "#e5e5e5",
        }),
        h(
          "text",
          {
            x: M.left - 10,
            y: y(t),
            textAnchor: "end",
            dominantBaseline: "middle",
            fontSize: 17,
            fill: "#666",
          },
          t,
        ),
      ),
    ),
    // bars
    counts.map((count, i) => {
      const x0 = x(breaks[i]);
      const x1 = x(breaks[i + 1]);
      return h("rect", {
        key: i,
        x: x0,
        width: Math.max(x1 - x0 - 1, 1),
        y: y(count),
        height: M.top + PLOT_H - y(count),
        fill: "#447099",
      });
    }),
    // x axis
    h("line", {
      x1: M.left,
      x2: M.left + PLOT_W,
      y1: M.top + PLOT_H,
      y2: M.top + PLOT_H,
      stroke: "#888",
    }),
    xTicks(lo, hi).map((t) =>
      h(
        "text",
        {
          key: `x${t}`,
          x: x(t),
          y: M.top + PLOT_H + 24,
          textAnchor: "middle",
          fontSize: 17,
          fill: "#666",
        },
        t,
      ),
    ),
    h(
      "text",
      {
        x: M.left + PLOT_W / 2,
        y: H - 8,
        textAnchor: "middle",
        fontSize: 18,
        fill: "#333",
      },
      "Waiting time to next eruption (minutes)",
    ),
    h(
      "text",
      {
        transform: `translate(16 ${M.top + PLOT_H / 2}) rotate(-90)`,
        textAnchor: "middle",
        fontSize: 18,
        fill: "#333",
      },
      "Frequency",
    ),
  );
}

// --- app -------------------------------------------------------------------

function App() {
  const initialized = useShinyInitialized();
  const [binCount, setBinCount] = useShinyInput("bin_count", 30);
  const bins = useShinyOutputValue("dist_data", null);
  const status = useShinyOutputStatus("dist_data");

  if (!initialized) return null;

  return h(
    "main",
    { className: "layout" },
    h(
      "aside",
      { className: "sidebar" },
      h("label", { htmlFor: "bin_count" }, "Number of bins:"),
      h("input", {
        id: "bin_count",
        type: "range",
        min: 1,
        max: 50,
        value: binCount,
        onChange: (e) => setBinCount(Number(e.target.value)),
      }),
      h("output", { htmlFor: "bin_count", className: "bin-count-value" }, binCount),
    ),
    h(
      "section",
      { className: "panel" },
      h("h1", null, "Hello Shiny!"),
      // Keep the chart mounted while the server recomputes — only show the
      // placeholder before the first value has ever arrived.
      bins
        ? h(
            "div",
            { className: status === "recalculating" ? "recalculating" : "" },
            h(Histogram, { bins }),
          )
        : h("div", { className: "placeholder" }, "Loading…"),
    ),
  );
}

const root = ReactDOM.createRoot(document.getElementById("root"));
root.render(h(App));
Testing
Test coverage at every hop
- Within the server —
testServer()/test_server()·local_server - Server → client —
wire_tap - Within the client — JS unit tests
- Confirm the client —
features.md
Future work
- Embed React components into existing apps
- Wrap
shinyreactin your own package!
shinyreact
- R / Python server processes data
- Build React client using AI agent
- Communicate using JSON and IDs
- posit-dev/shinyreact
Barret Schloerke
posit / Shiny Team
@schloerke
In the wild
Samuel Bharti.com

- Shiny summer ’26 intern
- Ph.D. candidate, UAB
- Computational biologist
- 10x Shiny apps, 5x packages
- posit-dev/shiny-showcase-bioinformatics

Summer Packages
- biobouncer
![R]()
![Python]() – Is this a valid ID?
– Is this a valid ID?


- bioclients
![R]() – What do the sources say?
– What do the sources say?
- biohttp
![R]() – Move bytes, cache results
– Move bytes, cache results
- biocohort
![R]() – One study, one object
– One study, one object
- plotomics
![R]()
![Python]() – 17 GPU-accelerated charts
– 17 GPU-accelerated charts




Summer Bioinformatics Apps
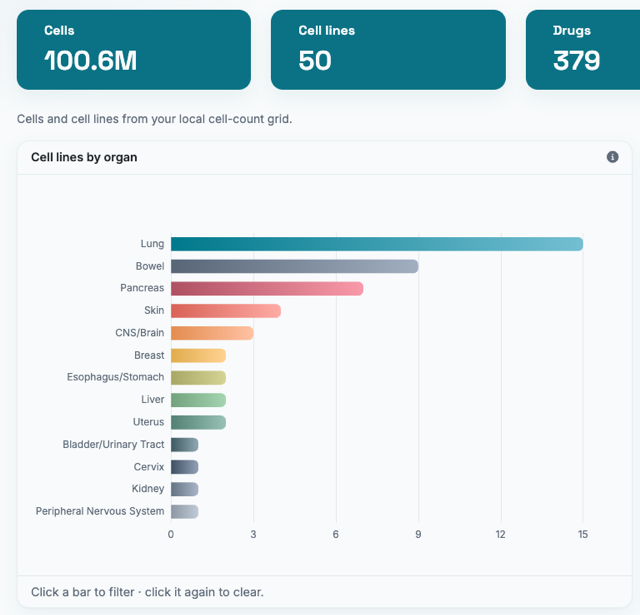
- tahoe-explorer · 100.6M rows
- Summaries push into DuckDB · source
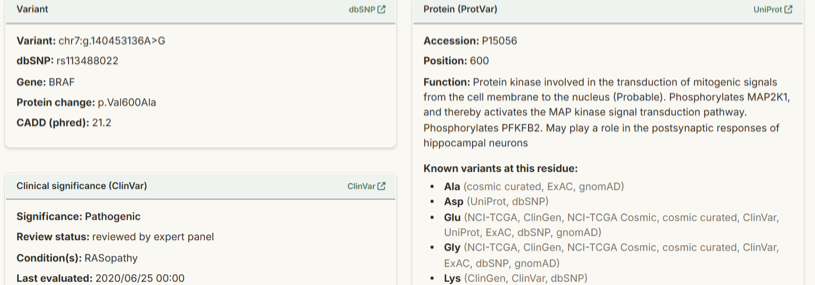
- variant-reviewer · 23 cards
- Public APIs, fanned out async · source
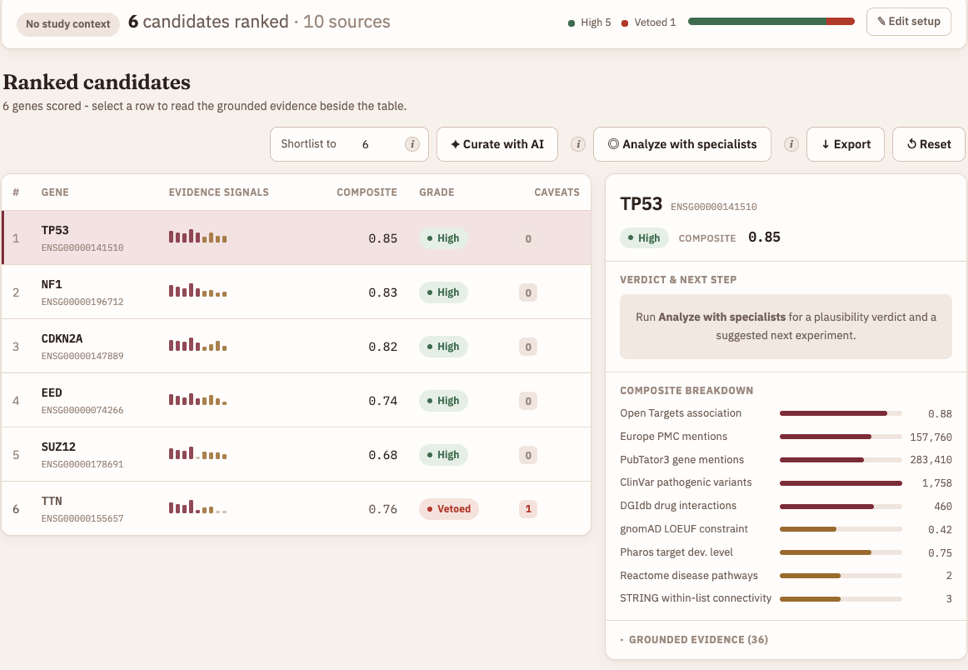
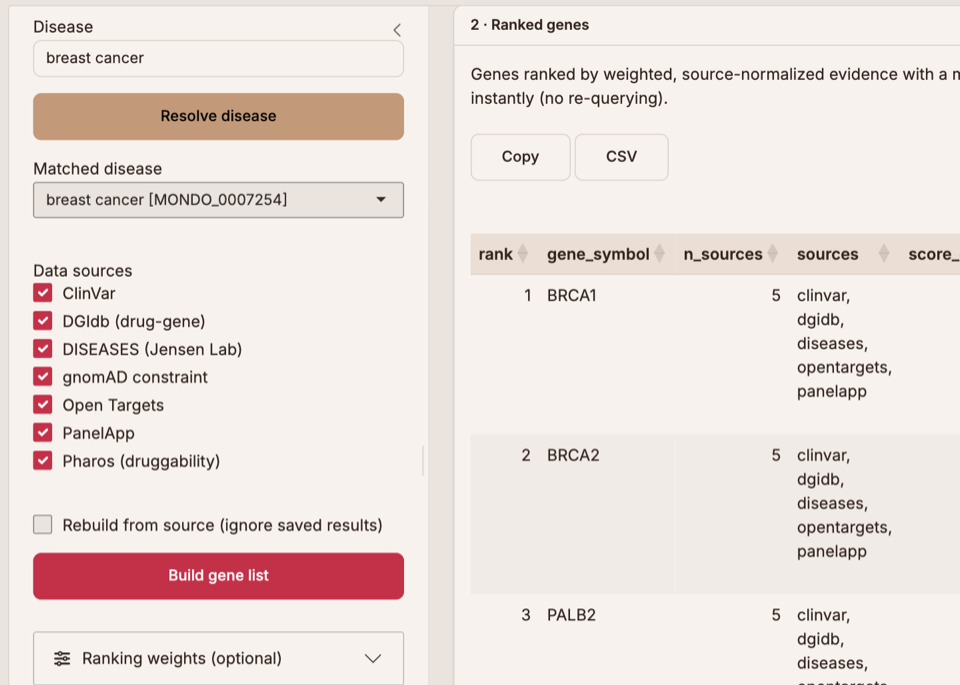
- gene-list-builder · 7 sources
- Re-ranks as you tune the weights · source
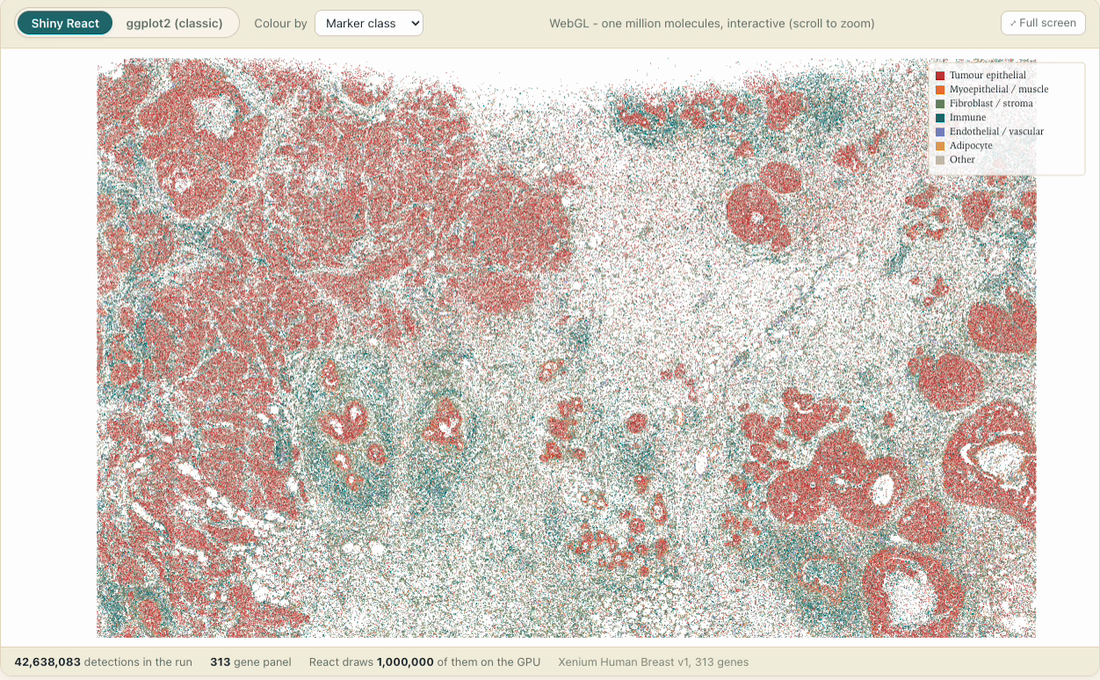
- Plotomics Live ·
shinyreact- 1M WebGL points, one line of UI · source
Plotomics Live
1,000,000 transcripts on the GPU · 26 visualizations · 65+ reactive_output()
posit::conf(2026) · @schloerke